Posted on Leave a comment

µRadMonitor RRDTool Graphing

I’ve been meaning to sort some local graphs out for a while for the radiation monitor, and I found a couple of scripts created by a couple of people over at the uRadMonitor forums for doing exactly this with RRDTool.

µRadLogger
µRadLogger

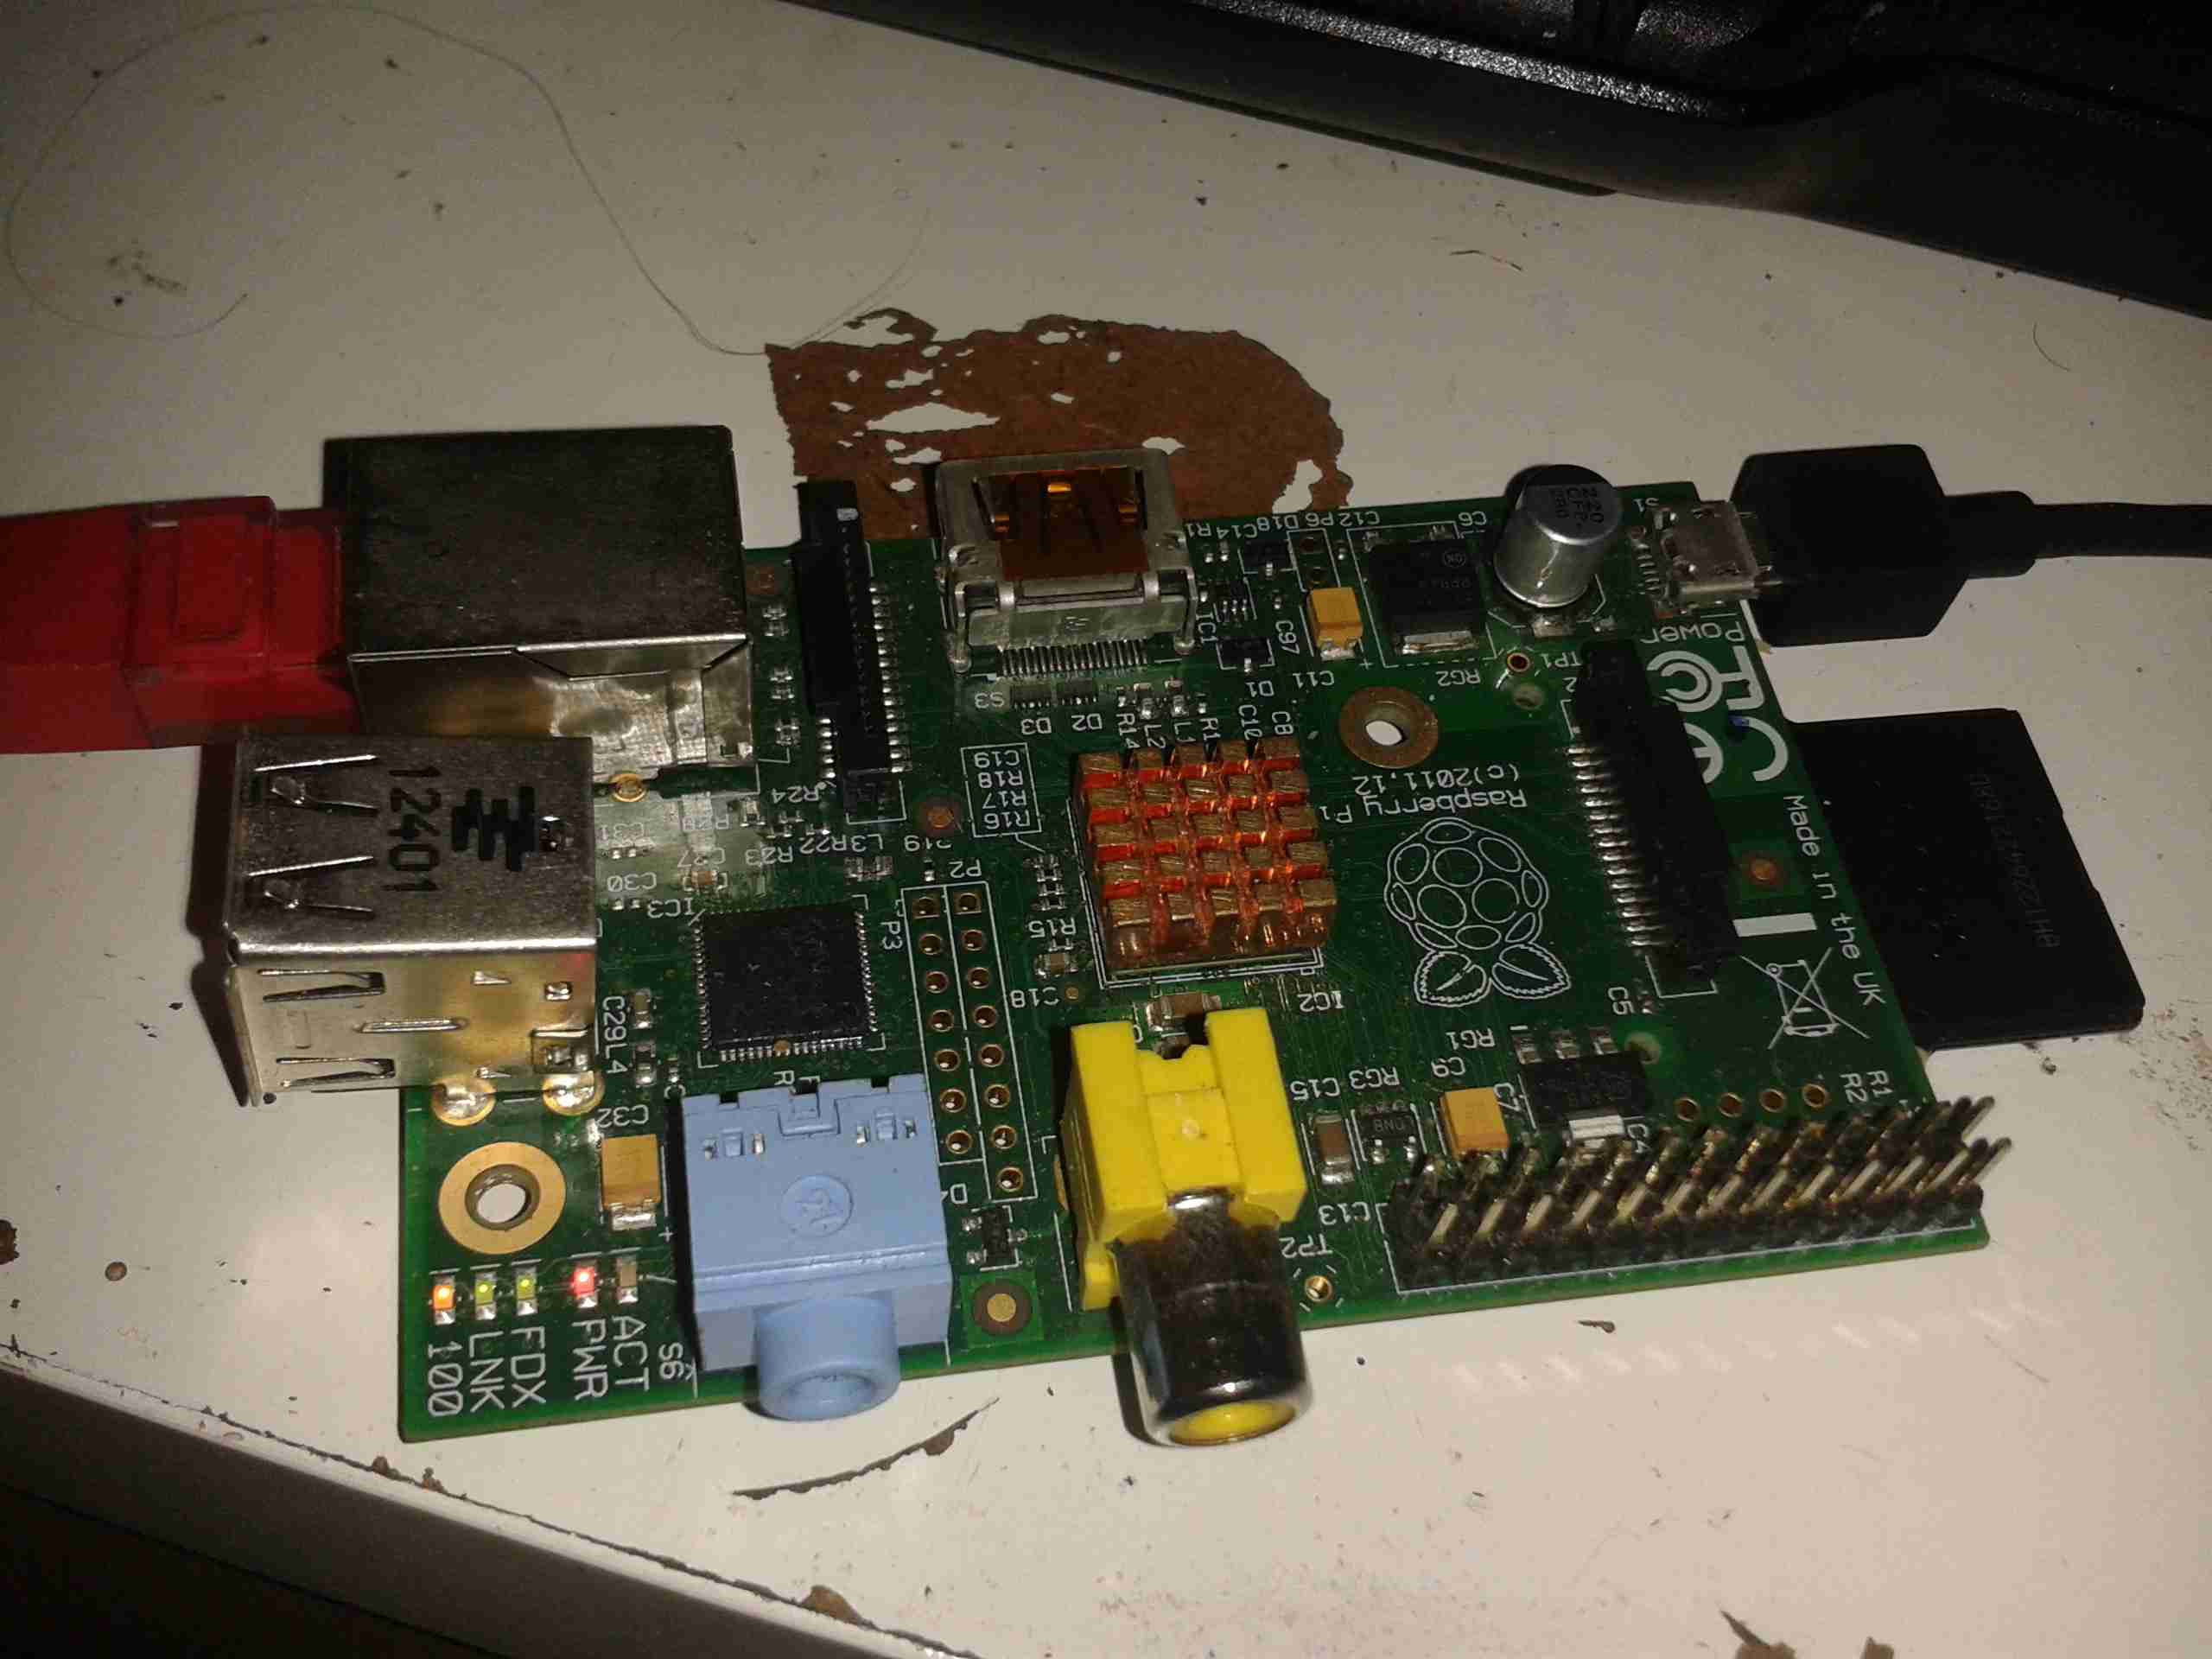
Using another Raspberry Pi I had lying around, I’ve implemented these scripts on a minimal Raspbian install, and with a couple of small modifications, the scripts upload the resulting graphs to the blog’s webserver via FTP every minute.

#!/bin/sh

URL=http://192.168.1.4/j
rrdpath="/usr/local/bin"

jsondata=$( curl -s $URL);

v_cpm=$( echo $jsondata | cut -f 4 -d "," | cut -f 2  -d ":" )
v_temp=$( echo $jsondata | cut -f 5 -d "," | cut -f 2  -d ":" )

echo CPM : $v_cpm
echo Temperature : $v_temp

This script just grabs the current readings from the monitor, requiring access to it’s IP address for this.

#!/bin/sh

rrdpath="/usr/bin"
rrddata="/usr/local/urad/data"
rrdgraph="/usr/local/urad/graph"

mkdir $rrddata
mkdir $rrdgraph

   $rrdpath/rrdtool create $rrddata/uRadMonitor.rrd -s 60 \
            DS:cpm:GAUGE:300:0:U   \
            DS:temp:GAUGE:300:-100:100  \
            RRA:AVERAGE:0.5:1:600  \
            RRA:AVERAGE:0.5:6:700  \
            RRA:AVERAGE:0.5:24:775 \
            RRA:AVERAGE:0.5:288:797 \
            RRA:MAX:0.5:1:600 \
            RRA:MAX:0.5:6:700 \
            RRA:MAX:0.5:24:775 \
            RRA:MAX:0.5:288:797
   echo database $rrddata/uRadMonitor.rrd created.

This script sets up the RRDTool data files & directories.

#!/bin/sh

URL=http://192.168.1.4/j
rrdpath="/usr/bin"
rrddata="/usr/local/urad/data"
rrdgraph="/usr/local/urad/graph"
rrdfmt="--font AXIS:6: --font TITLE:9: --font UNIT:7: --font LEGEND:7: --font-render-mode mono --color ARROW#000000 --color GRID#8C8C8C --color MGRID#000000 -v \"cpm\" --alt-y-mrtg --width 600"

jsondata=$( curl -s $URL );

v_cpm=$( echo $jsondata | cut -f 4 -d "," | cut -f 2  -d ":" )
v_temp=$( echo $jsondata | cut -f 5 -d "," | cut -f 2  -d ":" )

echo CPM : $v_cpm
echo Temperature : $v_temp


$rrdpath/rrdtool update $rrddata/uRadMonitor.rrd N:$v_cpm:$v_temp


$rrdpath/rrdtool graph --imgformat PNG $rrdgraph/rad-day.png   --start -86400 --end -600 --title "Radiation daily" $rrdfmt \
        DEF:cpm=$rrddata/uRadMonitor.rrd:cpm:AVERAGE \
                AREA:cpm#00CCCC:"Counts Per Minute\g" \
                        GPRINT:cpm:MAX:"  Max \: %5.1lf " \
                        GPRINT:cpm:AVERAGE:" Avg \: %5.1lf " \
                        GPRINT:cpm:LAST:" Last \: %5.1lf \l"

$rrdpath/rrdtool graph --imgformat PNG $rrdgraph/rad-week.png  --start -604800   -z    --title "Radiation weekly" $rrdfmt \
        DEF:cpm=$rrddata/uRadMonitor.rrd:cpm:AVERAGE \
                AREA:cpm#00CCCC:"Counts Per Minute\g" \
                        GPRINT:cpm:MAX:"  Max \: %5.1lf " \
                        GPRINT:cpm:AVERAGE:" Avg \: %5.1lf " \
                        GPRINT:cpm:LAST:" Last \: %5.1lf \l"

$rrdpath/rrdtool graph --imgformat PNG $rrdgraph/rad-month.png --start -2592000  -z    --title "Radiation monthly" $rrdfmt \
        DEF:cpm=$rrddata/uRadMonitor.rrd:cpm:AVERAGE \
                AREA:cpm#00CCCC:"Counts Per Minute\g" \
                        GPRINT:cpm:MAX:"  Max \: %5.1lf " \
                        GPRINT:cpm:AVERAGE:" Avg \: %5.1lf " \
                        GPRINT:cpm:LAST:" Last \: %5.1lf \l"

$rrdpath/rrdtool graph --imgformat PNG $rrdgraph/rad-year.png  --start -31536000 -z    --title "Radiation yearly" $rrdfmt \
        DEF:cpm=$rrddata/uRadMonitor.rrd:cpm:AVERAGE \
                AREA:cpm#00CCCC:"Counts Per Minute\g" \
                        GPRINT:cpm:MAX:"  Max \: %5.1lf " \
                        GPRINT:cpm:AVERAGE:" Avg \: %5.1lf " \
                        GPRINT:cpm:LAST:" Last \: %5.1lf \l"

$rrdpath/rrdtool graph --imgformat PNG $rrdgraph/rad-decade.png  --start -315360000 -z    --title "Radiation decadely" $rrdfmt \
        DEF:cpm=$rrddata/uRadMonitor.rrd:cpm:AVERAGE \
                AREA:cpm#00CCCC:"Counts Per Minute\g" \
                        GPRINT:cpm:MAX:"  Max \: %5.1lf " \
                        GPRINT:cpm:AVERAGE:" Avg \: %5.1lf " \
                        GPRINT:cpm:LAST:" Last \: %5.1lf \l"
ncftpput -R -v -u "<FTP_USER>" -p "<FTP_PASSWORD>" <FTP_HOST> <FTP_REMOTE_DIR> /usr/local/urad/graph/*

The final script here does all the data collection from the monitor, updates the RRDTool data & runs the graph update. This runs from cron every minute.
I have added the command to automate FTP upload when it finishes with the graph generation.

This is going to be mounted next to the monitor itself, running from the same supply.

The Graphs are available over at this page.

Leave a Reply

Your email address will not be published. Required fields are marked *

This site uses Akismet to reduce spam. Learn how your comment data is processed.