Posted on 2 Comments

PiHole Status Display – Official Raspberry Pi LCD

PiHole Status Display

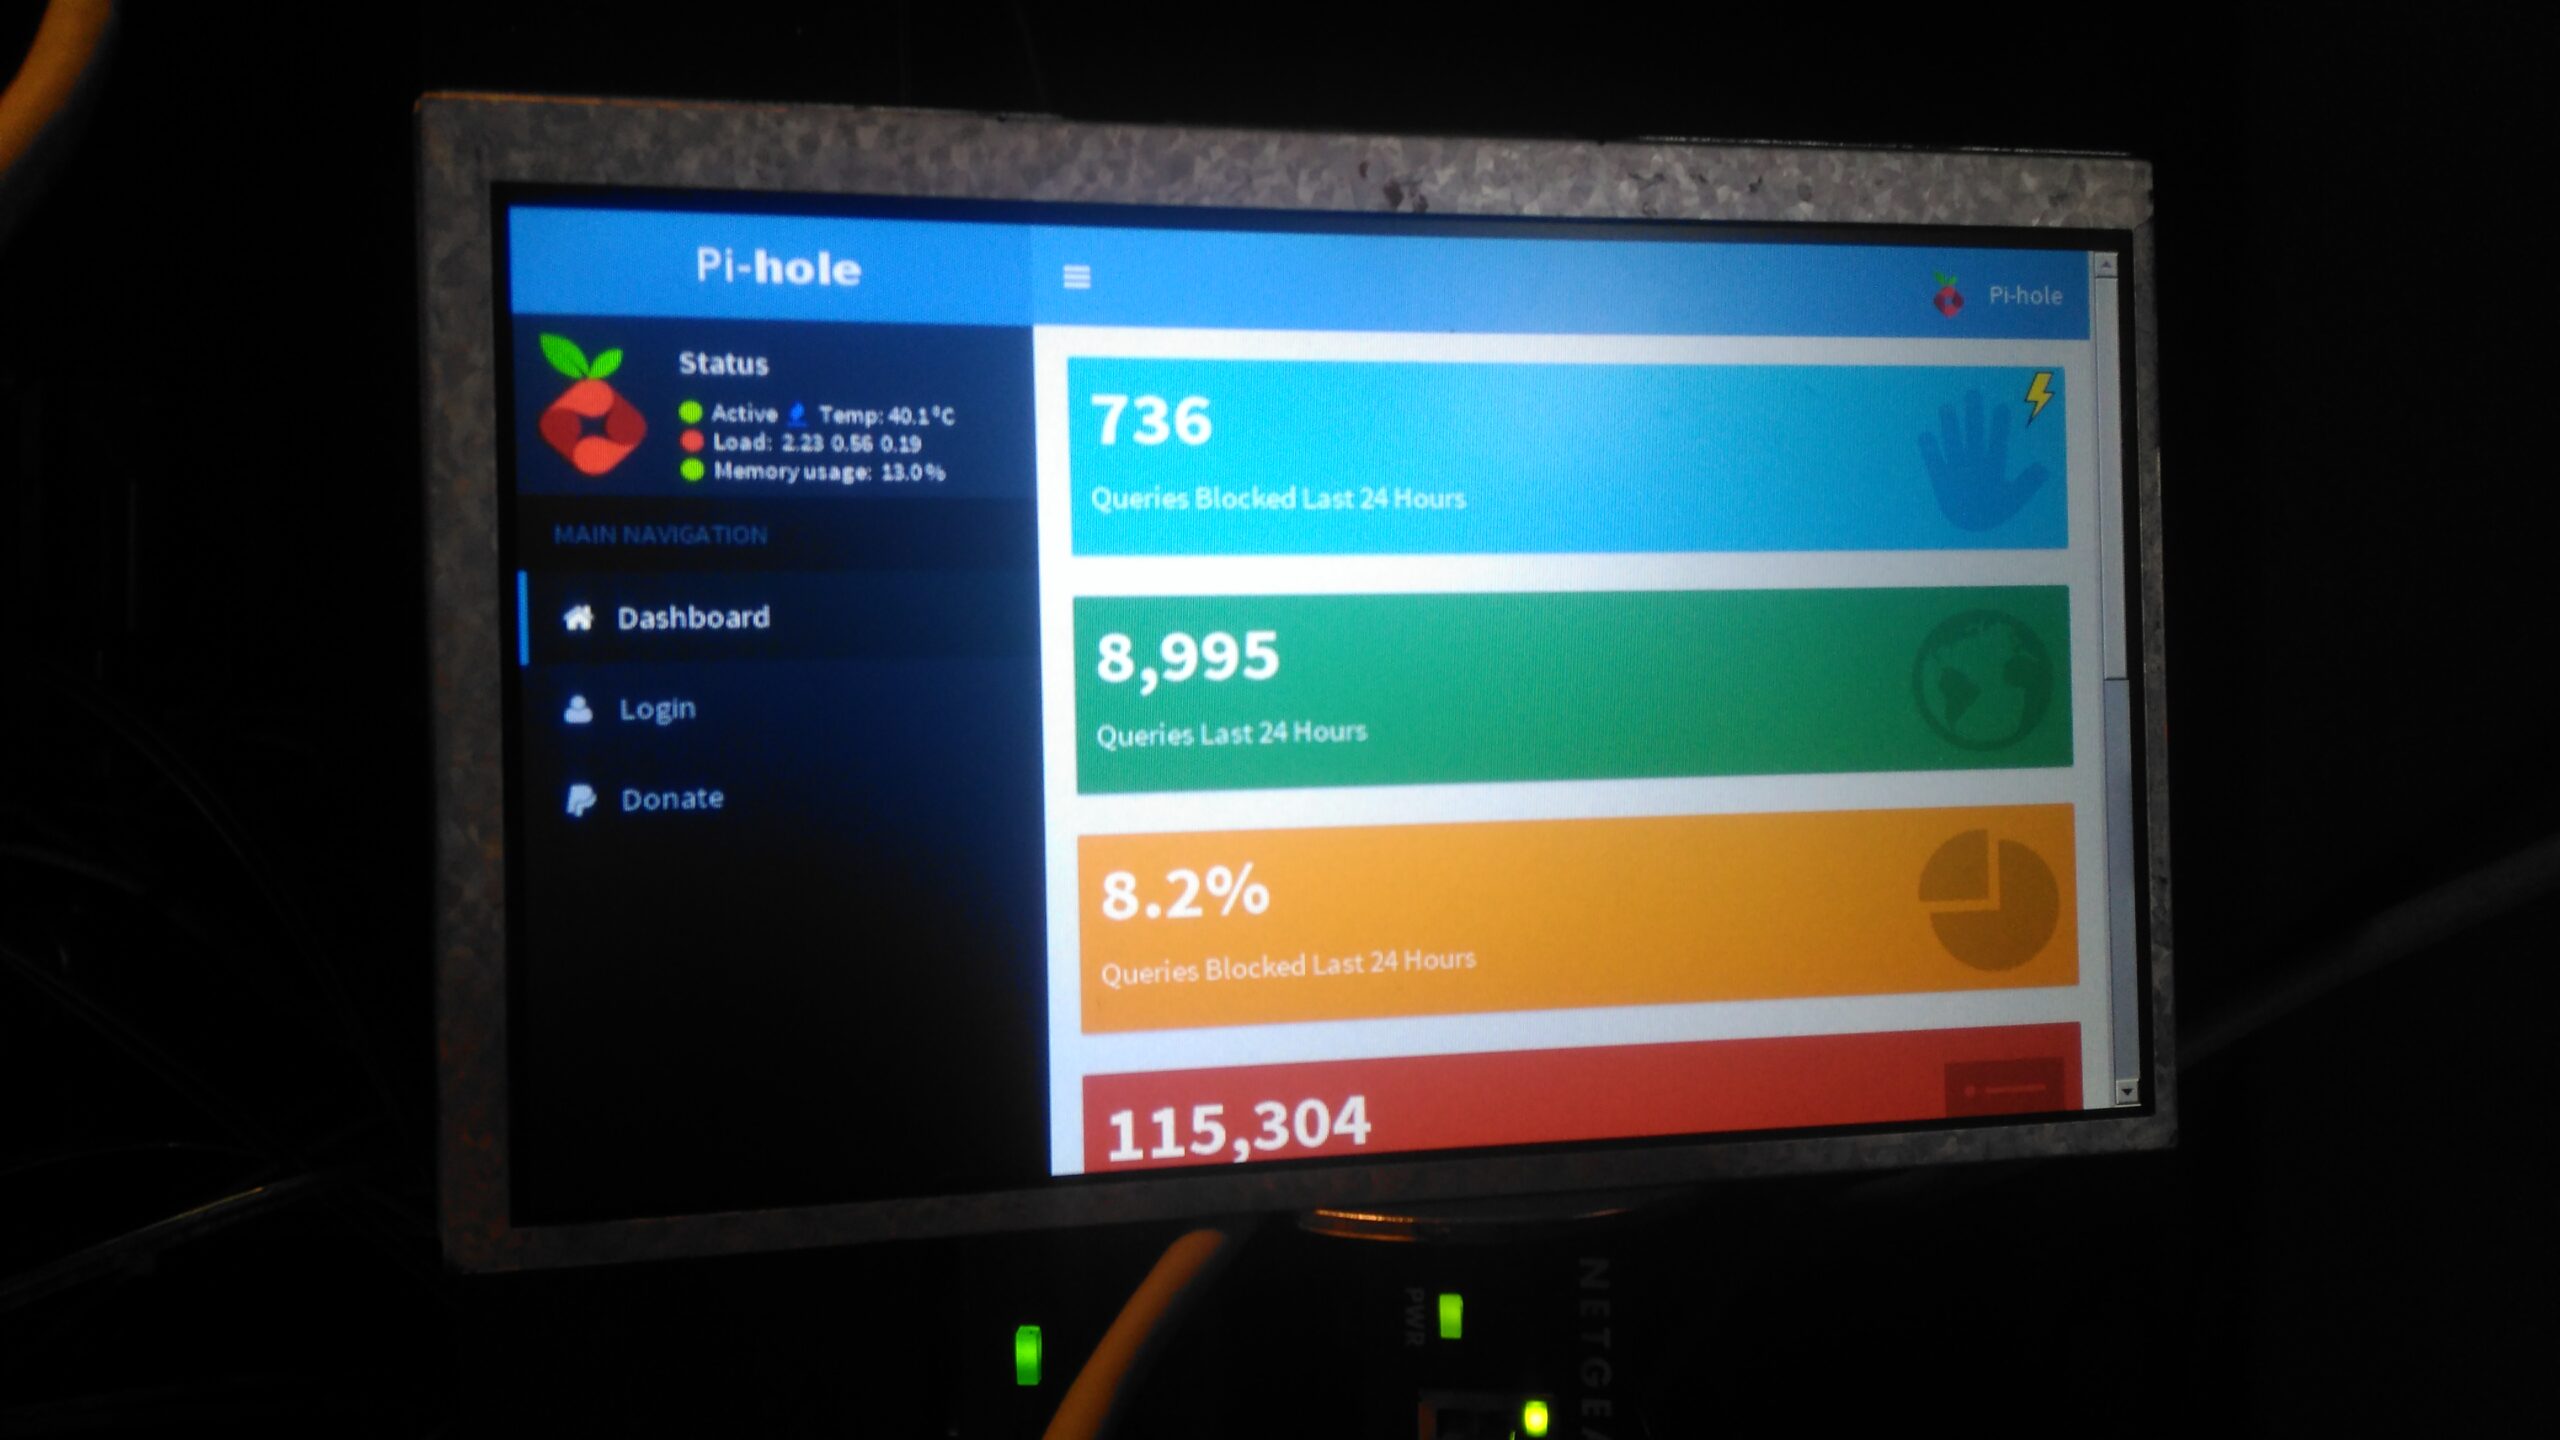
On my home network I have a system running PiHole – a DNS server that blocks all unwanted traffic, such as ads. Since I have an official Pi LCD with a broken touch panel, I decided to use the bare LCD as a status display for PiHole.

This requires some extra packages installing onto the base system after PiHole is installed & configured, and the interface automatically starts on bootup. I used the latest Raspbian Jessie Minimal image for this system, and ran everything over a SSH connection.

First thing, get the required packages installed onto the Pi:

Once these are installed, it’s time to configure the startup script for Midori to display the status page. Create StartMidori.sh in /home/pi and fill with the following:

This script disables all power management on the system to keep the LCD on, starts unclutter to hide the mouse pointer and finally starts the Matchbox Window Manager to run Midori, which itself is set to fullscreen mode, and the URL of the admin panel is provided.
The next step is to test, give the script executable permissions, and run the script:

Once this is run, the LCD should come to life after a short delay with the PiHole stats screen. Close the test & return to the terminal by hitting CTRL+C.

Now the Pi can be configured to autorun this script on boot, the first thing to do here is to enable autologin on the console. This can be done with raspi-config, select Option 3 (Boot Options), then Option B1 (Desktop/CLI), then Option B2 (Console Autologin). When prompted to reboot, select No, as we’ll be finishing off the config before we reboot the system.

The next file to edit is /etc/rc.local, add the command to start the status browser up:

Here I’ve added in the command just above “exit 0”. This will start the browser as the last thing on bootup. The Pi can now be rebooted, and the status display should start on boot!

PiHole Status Display
Posted on Leave a comment

Securing The New Server & Security In General

This was originally going to be part of another post, but it ended up getting more complex than I originally intended so it’s been given it’s own. I go into into many of my personal security practices, on both my public facing servers & personal machines. Since the intertubes are so central to life these days, good security is a must, especially since most people use the ‘net to do very sensitive operations, such as banking, it’s becoming even more essential to have strong security.

Since bringing the new server online & exposing it to the world, it’s been discovered in record time by the scum of the internet, SSH was under constant attack within 24 hours, and within that time there were over 20,000 failed login attempts in the logs.
This isn’t much of an issue, as I’ve got a strong Fail2Ban configuration running which at the moment is keeping track of some 30 IP addresses that are constantly trying to hammer their way in. No doubt these will be replaced with another string of attacks once they realise that those IPs are being dropped. I also prevent SSH login with passwords – RSA keys only here.
MySQL is the other main target to be concerned about – this is taken care of by disabling root login remotely, and dropping all MySQL traffic at the firewall that hasn’t come from 127.0.0.1.

Keeping the SSH keys on an external device & still keeping things simple just requires some tweaking to the .bashrc file in Linux:

This little snippet makes the ssh client look somewhere else for the keys themselves, while keeping typing to a minimum in the Terminal. This assumes the external storage with the keys always mounts to the same location.

Everything else that can’t be totally blocked from outside access (IMAP, SMTP, FTP, etc), along with Fail2Ban protection, gets very strong passwords, unique to each account, (password reuse in any situation is a big no-no) and where possible TOTP-based two factor authentication is used for front end stuff, all the SSH keys, master passwords & backup codes are themselves kept offline, on encrypted storage, except for when they’re needed. General password management is taken care of by LastPass, and while they’ve been subject to a couple of rather serious vulnerabilities recently, these have been patched & it’s still probably one of the best options out there for a password vault.
There’s more information about those vulnerabilities on the LastPass blog here & here.


This level of security paranoia ensures that unauthorized access is made extremely difficult – an attacker would have to gain physical access to one of my mobile devices with the TOTP application, and have physical access to the storage where all the master keys are kept (along with it’s encryption key, which is safely stored in Meatware), to gain access to anything.
No security can ever be 100% perfect, there’s always going to be an attack surface somewhere, but I’ll certainly go as far as is reasonable, while not making my access a total pain, to keep that attack surface as small as possible,and therefore keeping the internet scum out of my systems.
The last layer of security is a personal VPN server, which keeps all traffic totally encrypted while it’s in transit across my ISP’s network, until it hits the end point server somewhere else in the world. Again, this isn’t perfect, as the data has to be decrypted *somewhere* along the chain.

Posted on Leave a comment

Website Hosting Updates!

Over the past few weeks, the host I’ve been with for over 3 years, OVH, announced a rather large price increase of 20% because of Brexit – the current universal excuse to squeeze the customer for more cash. This change has sent the price of my dedicated server solution with them to over £45 a month. Doing some napkin-calculation gave me £18 a month in extra power to run a small server locally. So I’ve decided to bring the hosting solution back to my local network & run from my domestic internet link, which at 200Mbit/s DL & 20Mbit/s UL should be plenty fast enough to handle the modest levels of traffic I usually get.

Obviously, some hardware was required for this, so I obtained this beauty cheap on eBay:

HP MicroServer Gen 8
HP Proliant MicroServer Gen 8

This is a Gen 8 HP Proliant Microserver, very small & quiet, perfect for the job. This came with 4GB of RAM installed from the factory, and a Celeron G1610T running at 2.3GHz. Both are a little limited, so some upgrades will be made to the system.

Disk Bays
Disk Bays

4 SATA drive bays are located behind the magnetically-locked front door, there’s a 250GB boot disk in here along with a pair of 500GB disks in RAID1 to handle the website files & databases. For my online file hosting site, the server has a backend NFS link direct to Volantis – my 28TB storage server. This arrangement keeps the large file storage side of things off the web server disks & on a NAS, where it should be.

Extra RAM
Extra RAM

First thing is a RAM upgrade to the full supported capacity of 16GB. This being a Proliant server machine, doesn’t take anything of a standard flavour, it’s requirements are DDR3-10600E or DDR3-12800E (the E in here being ECC). This memory is both eye-wateringly expensive & difficult to find anywhere in stock. It’s much cheaper & easier to find the ECC Registered variety, but alas this isn’t compatible.

Over the past 48 hours or so, I’ve been migrating everything over to the new baby server, with a couple of associated teething problems, but everything seems to have gone well so far. The remaining job to get everything running as it should is an external mail relay – sending any kind of email from a dynamic IP / domestic ISP usually gets it spam binned by the big providers instantly, regardless of it actually being spam or not – more to come on that setup & configuring postfix to use an external SMTP relay server soon!

If anyone does find something weird going on with the blog, do let me know via the contact page or comments!

Posted on Leave a comment

µRadMonitor RRDTool Graphing

I’ve been meaning to sort some local graphs out for a while for the radiation monitor, and I found a couple of scripts created by a couple of people over at the uRadMonitor forums for doing exactly this with RRDTool.

µRadLogger
µRadLogger

Using another Raspberry Pi I had lying around, I’ve implemented these scripts on a minimal Raspbian install, and with a couple of small modifications, the scripts upload the resulting graphs to the blog’s webserver via FTP every minute.

#!/bin/sh

URL=http://192.168.1.4/j
rrdpath="/usr/local/bin"

jsondata=$( curl -s $URL);

v_cpm=$( echo $jsondata | cut -f 4 -d "," | cut -f 2  -d ":" )
v_temp=$( echo $jsondata | cut -f 5 -d "," | cut -f 2  -d ":" )

echo CPM : $v_cpm
echo Temperature : $v_temp

This script just grabs the current readings from the monitor, requiring access to it’s IP address for this.

#!/bin/sh

rrdpath="/usr/bin"
rrddata="/usr/local/urad/data"
rrdgraph="/usr/local/urad/graph"

mkdir $rrddata
mkdir $rrdgraph

   $rrdpath/rrdtool create $rrddata/uRadMonitor.rrd -s 60 \
            DS:cpm:GAUGE:300:0:U   \
            DS:temp:GAUGE:300:-100:100  \
            RRA:AVERAGE:0.5:1:600  \
            RRA:AVERAGE:0.5:6:700  \
            RRA:AVERAGE:0.5:24:775 \
            RRA:AVERAGE:0.5:288:797 \
            RRA:MAX:0.5:1:600 \
            RRA:MAX:0.5:6:700 \
            RRA:MAX:0.5:24:775 \
            RRA:MAX:0.5:288:797
   echo database $rrddata/uRadMonitor.rrd created.

This script sets up the RRDTool data files & directories.

#!/bin/sh

URL=http://192.168.1.4/j
rrdpath="/usr/bin"
rrddata="/usr/local/urad/data"
rrdgraph="/usr/local/urad/graph"
rrdfmt="--font AXIS:6: --font TITLE:9: --font UNIT:7: --font LEGEND:7: --font-render-mode mono --color ARROW#000000 --color GRID#8C8C8C --color MGRID#000000 -v \"cpm\" --alt-y-mrtg --width 600"

jsondata=$( curl -s $URL );

v_cpm=$( echo $jsondata | cut -f 4 -d "," | cut -f 2  -d ":" )
v_temp=$( echo $jsondata | cut -f 5 -d "," | cut -f 2  -d ":" )

echo CPM : $v_cpm
echo Temperature : $v_temp


$rrdpath/rrdtool update $rrddata/uRadMonitor.rrd N:$v_cpm:$v_temp


$rrdpath/rrdtool graph --imgformat PNG $rrdgraph/rad-day.png   --start -86400 --end -600 --title "Radiation daily" $rrdfmt \
        DEF:cpm=$rrddata/uRadMonitor.rrd:cpm:AVERAGE \
                AREA:cpm#00CCCC:"Counts Per Minute\g" \
                        GPRINT:cpm:MAX:"  Max \: %5.1lf " \
                        GPRINT:cpm:AVERAGE:" Avg \: %5.1lf " \
                        GPRINT:cpm:LAST:" Last \: %5.1lf \l"

$rrdpath/rrdtool graph --imgformat PNG $rrdgraph/rad-week.png  --start -604800   -z    --title "Radiation weekly" $rrdfmt \
        DEF:cpm=$rrddata/uRadMonitor.rrd:cpm:AVERAGE \
                AREA:cpm#00CCCC:"Counts Per Minute\g" \
                        GPRINT:cpm:MAX:"  Max \: %5.1lf " \
                        GPRINT:cpm:AVERAGE:" Avg \: %5.1lf " \
                        GPRINT:cpm:LAST:" Last \: %5.1lf \l"

$rrdpath/rrdtool graph --imgformat PNG $rrdgraph/rad-month.png --start -2592000  -z    --title "Radiation monthly" $rrdfmt \
        DEF:cpm=$rrddata/uRadMonitor.rrd:cpm:AVERAGE \
                AREA:cpm#00CCCC:"Counts Per Minute\g" \
                        GPRINT:cpm:MAX:"  Max \: %5.1lf " \
                        GPRINT:cpm:AVERAGE:" Avg \: %5.1lf " \
                        GPRINT:cpm:LAST:" Last \: %5.1lf \l"

$rrdpath/rrdtool graph --imgformat PNG $rrdgraph/rad-year.png  --start -31536000 -z    --title "Radiation yearly" $rrdfmt \
        DEF:cpm=$rrddata/uRadMonitor.rrd:cpm:AVERAGE \
                AREA:cpm#00CCCC:"Counts Per Minute\g" \
                        GPRINT:cpm:MAX:"  Max \: %5.1lf " \
                        GPRINT:cpm:AVERAGE:" Avg \: %5.1lf " \
                        GPRINT:cpm:LAST:" Last \: %5.1lf \l"

$rrdpath/rrdtool graph --imgformat PNG $rrdgraph/rad-decade.png  --start -315360000 -z    --title "Radiation decadely" $rrdfmt \
        DEF:cpm=$rrddata/uRadMonitor.rrd:cpm:AVERAGE \
                AREA:cpm#00CCCC:"Counts Per Minute\g" \
                        GPRINT:cpm:MAX:"  Max \: %5.1lf " \
                        GPRINT:cpm:AVERAGE:" Avg \: %5.1lf " \
                        GPRINT:cpm:LAST:" Last \: %5.1lf \l"
ncftpput -R -v -u "<FTP_USER>" -p "<FTP_PASSWORD>" <FTP_HOST> <FTP_REMOTE_DIR> /usr/local/urad/graph/*

The final script here does all the data collection from the monitor, updates the RRDTool data & runs the graph update. This runs from cron every minute.
I have added the command to automate FTP upload when it finishes with the graph generation.

This is going to be mounted next to the monitor itself, running from the same supply.

The Graphs are available over at this page.